Stress-NG is a Linux stress tool developed by Colin King of Canonical.
According to this page, stress-ng is a more general purpose stress tool that checks various kernel interfaces in particular. Within Phoronix, the following subtests have been enabled:
Stress-NG 0.07.26:
    pts/stress-ng-1.2.1
    System Test Configuration
        1:  CPU Stress
        2:  Crypto
        3:  Memory Copying
        4:  Glibc Qsort Data Sorting
        5:  Glibc C String Functions
        6:  Vector Math
        7:  Matrix Math
        8:  Bsearch
        9:  Hsearch
        10: Lsearch
        11: Tsearch
        12: Forking
        13: System V Message Passing
        14: Semaphores
        15: Socket Activity
        16: Context Switching
        17: Test All Options
        Test:
In the analysis below, I’ve run #15 (socket activity) and #13 (system V message passing) as these were exercised in this phoronix article. The runs below will show socket tests followed by message passing tests.
These sorts of tests are limited more by implementation than might be shown by traditional performance counters, but since these were easily collected will also include them below.
Metrics (Intel) - phoronix/stress-ngsh - pid 12778 // socket On_CPU 0.999 On_Core 7.988 IPC 0.564 Retire 0.381 (38.1%) FrontEnd 0.390 (39.0%) Spec 0.066 (6.6%) Backend 0.163 (16.3%) Elapsed 30.01 Procs 19 Maxrss 10K Minflt 1864 Majflt 0 Inblock 0 Oublock 8 Msgsnd 0 Msgrcv 0 Nsignals 0 Nvcsw 5207353 (50.2%) Nivcsw 5160392 Utime 10.813515 Stime 228.918882 Start 302230.18 Finish 302260.19 sh - pid 12900 // message On_CPU 0.991 On_Core 7.926 IPC 0.530 Retire 0.354 (35.4%) FrontEnd 0.314 (31.4%) Spec 0.063 (6.3%) Backend 0.270 (27.0%) Elapsed 30.02 Procs 19 Maxrss 10K Minflt 1874 Majflt 0 Inblock 0 Oublock 8 Msgsnd 0 Msgrcv 0 Nsignals 0 Nvcsw 956140 (54.1%) Nivcsw 810229 Utime 45.995359 Stime 191.950657 Start 302423.42 Finish 302453.44
The driver occupies the CPU almost 100% of the time with primary performance counter limiter as frontend stalls. Message passing shows slightly higher amounts of backend stalls.
Metrics (AMD) - phoronix/stress-ngsh - pid 31662 // socket On_CPU 0.998 On_Core 15.971 IPC 0.582 FrontCyc 0.132 (13.2%) BackCyc 0.068 (6.8%) Elapsed 30.02 Procs 35 Maxrss 10K Minflt 2899 Majflt 0 Inblock 0 Oublock 8 Msgsnd 0 Msgrcv 0 Nsignals 0 Nvcsw 21404922 (50.2%) Nivcsw 21257112 Utime 13.372083 Stime 466.069554 Start 311413.35 Finish 311443.37 sh - pid 31879 // message On_CPU 0.992 On_Core 15.871 IPC 0.563 FrontCyc 0.057 (5.7%) BackCyc 0.069 (6.9%) Elapsed 30.02 Procs 35 Maxrss 10K Minflt 2836 Majflt 0 Inblock 0 Oublock 8 Msgsnd 0 Msgrcv 0 Nsignals 0 Nvcsw 4578986 (50.9%) Nivcsw 4420861 Utime 28.585237 Stime 447.870134 Start 311606.61 Finish 311636.63
Metrics on my AMD system look similar.
Process Tree - phoronix/stress-ng
Process Tree
The user-level process tree is simple, with one driver process per core.
    12778) sh // socket
      12779) stress-ng
        12780) stress-ng
          12781) stress-ng-sock
            12784) stress-ng-sock
          12782) stress-ng-sock
            12786) stress-ng-sock
          12783) stress-ng-sock
            12788) stress-ng-sock
          12785) stress-ng-sock
            12789) stress-ng-sock
          12787) stress-ng-sock
            12791) stress-ng-sock
          12790) stress-ng-sock
            12793) stress-ng-sock
          12792) stress-ng-sock
            12795) stress-ng-sock
          12794) stress-ng-sock
            12796) stress-ng-sock
Socket version above.
    12900) sh
      12901) stress-ng
        12902) stress-ng
          12903) stress-ng-msg
            12907) stress-ng-msg
          12904) stress-ng-msg
            12908) stress-ng-msg
          12905) stress-ng-msg
            12910) stress-ng-msg
          12906) stress-ng-msg
            12911) stress-ng-msg
          12909) stress-ng-msg
            12912) stress-ng-msg
          12913) stress-ng-msg
            12916) stress-ng-msg
          12914) stress-ng-msg
            12918) stress-ng-msg
          12915) stress-ng-msg
            12917) stress-ng-msg
Message passing version above.
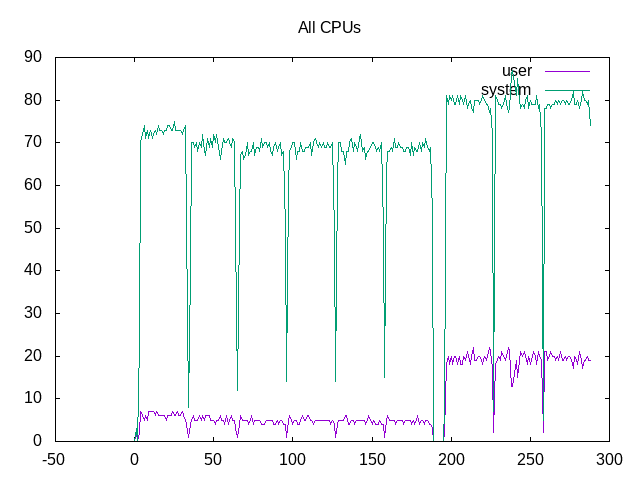
Looking at the total time across all cores show this is primarily a test of kernel interfaces and code. The socket tests are < 10% in user space while the message passing are ~20%
 About this graph
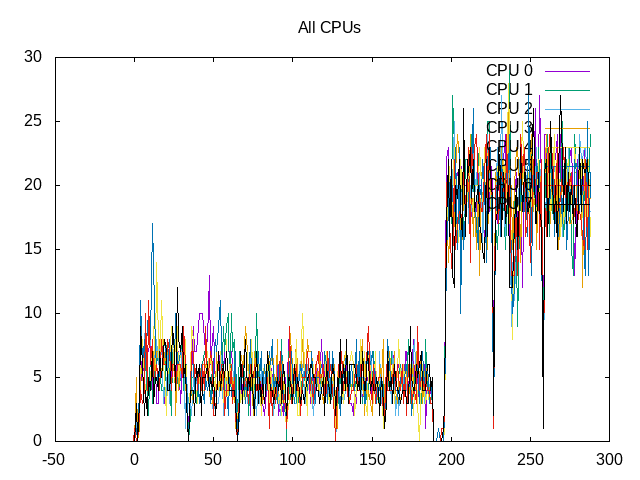
Within the user space, some volatility of amount of user space across cores.
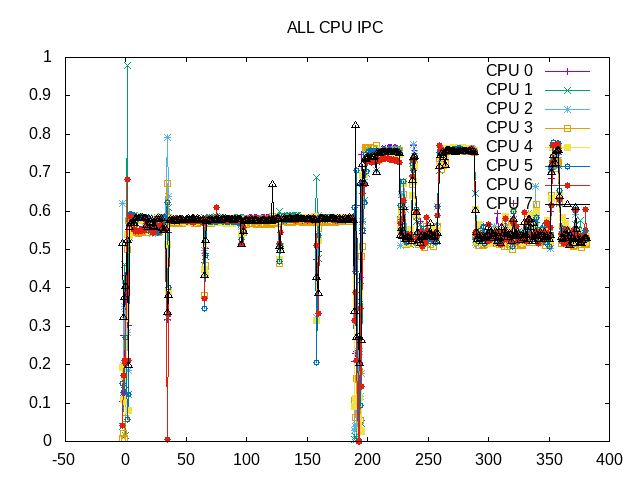
Somewhat expected, the IPC of this type of test is lower just a little less than 0.6.
 About this graph
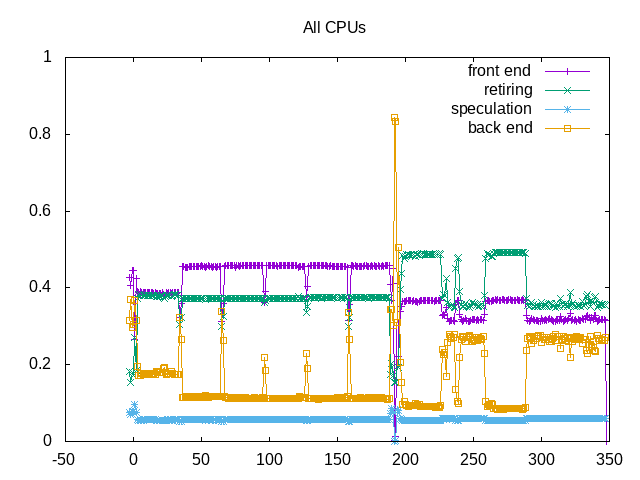
From a performance counter perspective, this shows a higher level of frontend stalls and some backend stalls. Interesting some variations shown in the backend stalls during some runs particularly for message passing.
Next steps: Understand other stress-ng workloads.