
This is a benchmark of John The Ripper, which is a password cracker.
The test case uses three different encryption schemes: blowfish, traditional DES and MD5. One executable supports all three and these are differentiated with the –format= option for “bcrypt” (blowfish), “descrypt” (DES) “md5crypt” (MD5) and this is the order these are run. The –test option is given to have each test example run for 20 sections, though it appears the DES might do two different phases, so 40 seconds total.
Metrics (Intel) - phoronix/john-the-ripper
Metrics for all three encryption types:
sh - pid 32003 // blowfish
	On_CPU   0.996
	On_Core  7.971
	IPC      1.688
	Retire   0.675	(67.5%)
	FrontEnd 0.139	(13.9%)
	Spec     0.169	(16.9%)
	Backend  0.016	(1.6%)
	Elapsed  20.12
	Procs    10
	Minflt   1103
	Majflt   0
	Utime    160.38  	(100.0%)
	Stime    0.00    	(0.0%)
	Start    116333.63
	Finish   116353.75
sh - pid 32038 // DES
	On_CPU   0.998
	On_Core  7.986
	IPC      1.383
	Retire   0.570	(57.0%)
	FrontEnd 0.195	(19.5%)
	Spec     0.143	(14.3%)
	Backend  0.091	(9.1%)
	Elapsed  40.06
	Procs    10
	Minflt   2561
	Majflt   0
	Utime    319.89  	(100.0%)
	Stime    0.02    	(0.0%)
	Start    116404.13
	Finish   116444.19
sh - pid 32072  // MD5
	On_CPU   0.998
	On_Core  7.980
	IPC      1.516
	Retire   0.608	(60.8%)
	FrontEnd 0.227	(22.7%)
	Spec     0.156	(15.6%)
	Backend  0.009	(0.9%)
	Elapsed  20.10
	Procs    10
	Minflt   3666
	Majflt   0
	Utime    160.39  	(100.0%)
	Stime    0.01    	(0.0%)
	Start    116534.45
	Finish   116554.55
None of the workloads stalls much in the backend, so do not expect this benchmark to fit within caches and not be bound by core execution units. Speculation misses are slightly higher but otherwise all have a moderate to high retirement rate as well as IPC.
Metrics (AMD) - phoronix/john-the-rippersh - pid 5866 // blowfish On_CPU 0.995 On_Core 15.913 IPC 1.674 FrontCyc 0.003 (0.3%) BackCyc 0.004 (0.4%) Elapsed 20.17 Procs 18 Minflt 1154 Majflt 0 Utime 320.97 (100.0%) Stime 0.00 (0.0%) Start 423220.95 Finish 423241.12 sh - pid 5923 // DES On_CPU 0.941 On_Core 15.057 IPC 1.422 FrontCyc 0.008 (0.8%) BackCyc 0.052 (5.2%) Elapsed 40.10 Procs 18 Minflt 4062 Majflt 0 Utime 603.11 (99.9%) Stime 0.66 (0.1%) Start 423291.58 Finish 423331.68 sh - pid 5980 // MD5 On_CPU 0.996 On_Core 15.937 IPC 1.495 FrontCyc 0.001 (0.1%) BackCyc 0.018 (1.8%) Elapsed 20.13 Procs 18 Minflt 6273 Majflt 0 Utime 320.81 (100.0%) Stime 0.01 (0.0%) Start 423422.01 Finish 423442.14
The IPC is remarkably similar on Ryzen as on Haswell test machines.
Process Tree - phoronix/john-the-ripper
Process Tree
Process trees are simple, all of the following form
    32003) sh elapsed=20.12 start=2.71 finish=22.83
      32004) john-the-ripper elapsed=20.12 start=2.71 finish=22.83
        32005) john elapsed=20.11 start=2.72 finish=22.83
        32006) john elapsed=20.07 start=2.76 finish=22.83
        32007) john elapsed=20.07 start=2.76 finish=22.83
        32008) john elapsed=20.07 start=2.76 finish=22.83
        32009) john elapsed=20.07 start=2.76 finish=22.83
        32010) john elapsed=20.07 start=2.76 finish=22.83
        32011) john elapsed=20.07 start=2.76 finish=22.83
        32012) john elapsed=20.07 start=2.76 finish=22.83
 About this graph
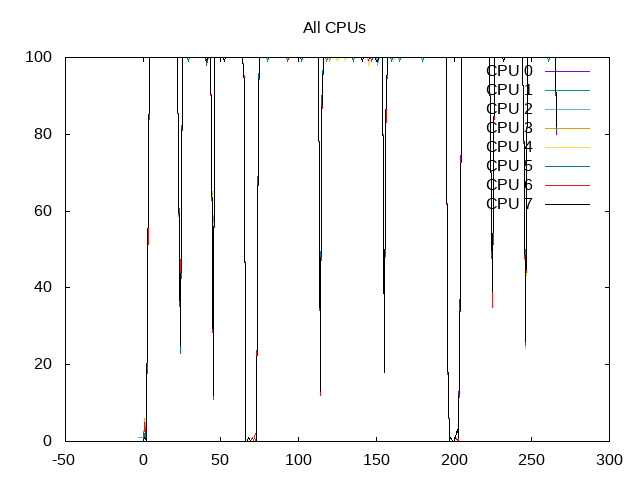
The CPU is scheduled at almost 100% of the time. The DES workload takes 40 seconds and others run for 20 seconds.
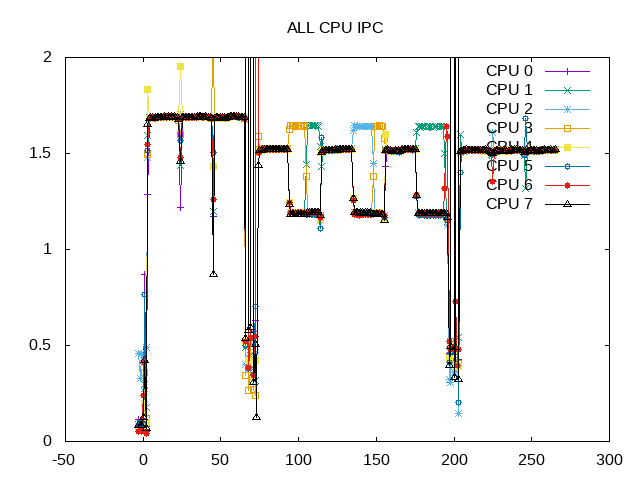
IPC as a whole is higher, with the DES workload having two phases.
 About this graph
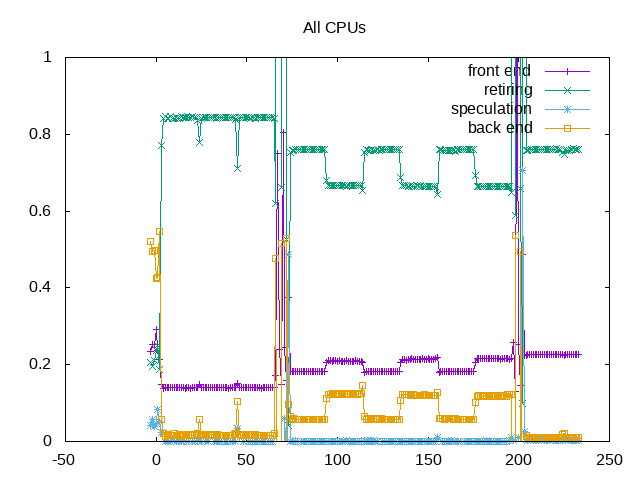
Backend stalls and bad speculation are not much of an issue. Front end is not a huge issue, but otherwise the largest limiter to this benchmark having even higher IPC.
Next Steps: Break out the DES workload and examine the front end stalls.