
This test measures the time needed to carry out some sample Git operations on an example, static repository that happens to be a copy of the GNOME
GTK tool-kit repository.
This test is more about filesystem than processor. While it might not be single-threaded, tests below pinned to one core so times could be aggregated.
Metrics (Intel) - phoronix/gitsh - pid 22797 On_CPU 0.125 On_Core 0.998 IPC 2.074 Retire 0.407 (40.7%) FrontEnd 0.165 (16.5%) Spec 0.238 (23.8%) Backend 0.190 (19.0%) Elapsed 5.92 Procs 60 Maxrss 219K Minflt 242973 Majflt 0 Inblock 0 Oublock 141688 Msgsnd 0 Msgrcv 0 Nsignals 0 Nvcsw 309 (35.5%) Nivcsw 562 Utime 5.508177 Stime 0.399221 Start 170135.88 Finish 170141.80
On_core is 100%. The IPC is medium with higher than average speculative stalls. The runtime is very quick at only 6 seconds. While there are some voluntary context switches, the On_core suggests not waiting substantially for I/O.
Metrics (AMD) - phoronix/gitsh - pid 8045 On_CPU 0.054 On_Core 0.871 IPC 2.068 FrontCyc 0.097 (9.7%) BackCyc 0.283 (28.3%) Elapsed 7.14 Procs 60 Maxrss 219K Minflt 243463 Majflt 0 Inblock 0 Oublock 141704 Msgsnd 0 Msgrcv 0 Nsignals 0 Nvcsw 320 (22.6%) Nivcsw 1093 Utime 5.854414 Stime 0.364961 Start 53673.37 Finish 53680.51
AMD IPC is almost exactly the same.
Process Tree - phoronix/gitProcess Tree
    22797) sh
      22798) git
        22799) git
        22800) git
        22801) git
        22802) git
        22803) git
        22804) git
        22805) git
        22806) git
        22807) git
        22808) git
        22809) git
        22810) git
        22811) git
        22812) mv
        22813) git
        22814) git
          22823) git
        22815) git
        22816) git
        22817) git
        22818) git
        22819) git
        22820) git
        22821) git
        22822) git
        22824) git
        22825) git
        22826) git
        22827) git
        22828) git
        22829) git
        22830) git
        22831) git
        22832) git
        22833) git
          22834) git
        22835) git
        22836) git
        22837) git
        22838) git
        22839) git
        22840) git
        22841) git
        22842) git
        22843) git
        22844) git
        22845) git
        22846) git
        22847) git
        22848) git
        22849) git
        22850) git
        22851) git
        22852) git
        22853) git
        22854) git
        22855) git
        22856) git
As expected the process tree is many git operations.
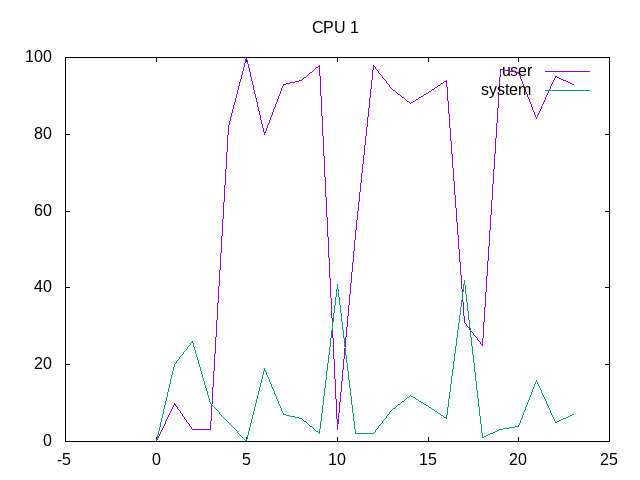
Short runtime shows some idle time, but metrics show when actually running it is 100% on a core.
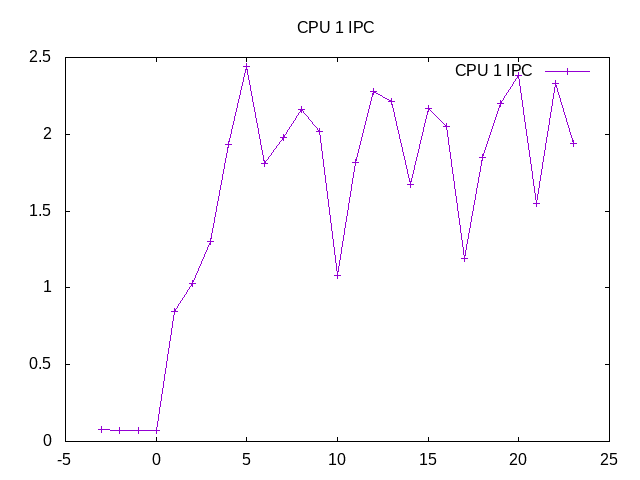
IPC has some noise.
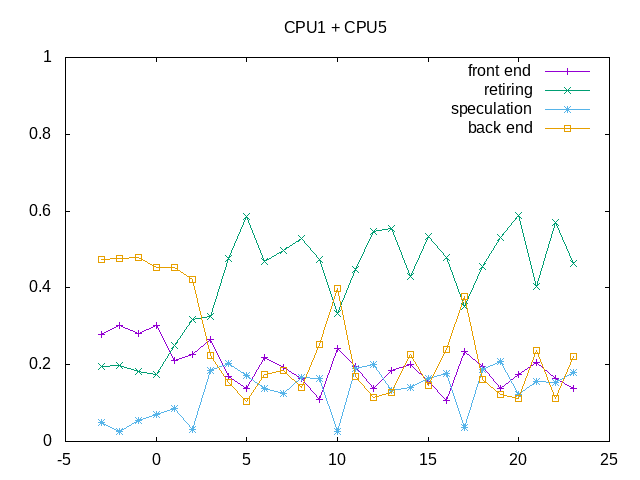
Speculative stalls contribute, otherwise some noise with a short-running benchmark.
on_cpu         0.103
elapsed        23.081
utime          16.423
stime          16.423
nvcsw          2852 (91.00%)
nivcsw         282 (9.00%)
inblock        0
inblock        3571096
retire         0.482
ms_uops                0.019
speculation    0.150
branch_misses          93.44%
machine_clears         6.56%
frontend       0.169
idq_uops_delivered_0   0.036
icache_stall               0.008
itlb_misses                0.001
idq_uops_delivered_1   0.063
idq_uops_delivered_2   0.098
idq_uops_delivered_3   0.145
dsb_ops                    74.18%
backend        0.200
resource_stalls.sb     0.023
stalls_ldm_pending     0.560
l2_refs                    0.014
l2_misses                  0.006
l2_miss_ratio              42.67%
l3_refs                    0.003
l3_misses                  0.000
l3_miss_ratio              17.56%
Branch misses appear to be an issue. Also shows an overall high rate of L2 references, but not missing into main memory.
Next steps: None